For Canadian practices outside Quebec
ABA data sheet template: ABC, frequency and interval recording sheets
An ABA data sheet template turns one agreed behaviour definition into a record that every observer reads the same way. This printable pack has three original sheets: ABC data for what happens around an event, frequency data for how often it happens, and interval data for whether it happens within timed blocks. Download it as a PDF or Word document with no sign-up, then use the fictional examples below to see how each sheet is filled in and totalled. A supervising clinician still chooses the method and the scoring rule.
Fictional example only. Adapt this to your clinic’s own policy and professional judgment. It is not clinical, legal or regulatory advice and does not claim to meet any payer, regulator or certification-body requirement. The child, behaviours and counts are invented and show no clinical target or result.
Last updated: 2026-10-08
Download a printable ABA data sheet template (PDF or Word)
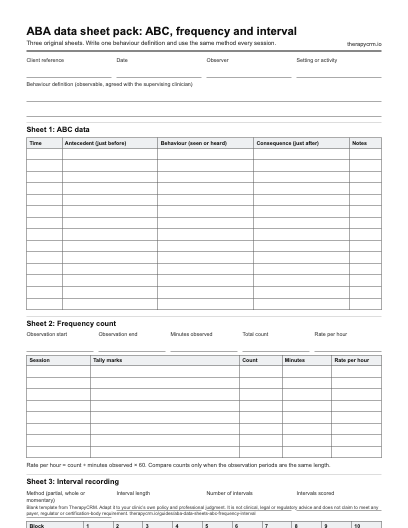
Three original sheets. Write one behaviour definition and use the same method every session. The blank PDF prints on US Letter paper (2 pages) and the Word document can be edited to match your clinic’s fields. Both are free to download with no sign-up.
Which ABA data sheet fits the question
ABA data collection sheets differ by the question they answer. Pick the sheet that matches the question first, then write the behaviour definition and the scoring rule the sheet will use. Duration and latency need their own timing sheets, which are not part of this pack.
| Sheet | Question it answers | What it records | Watch for |
|---|---|---|---|
| ABC data | What happened just before and just after an event? | The antecedent, the behaviour and the consequence for each event, with the time | Record what was seen or heard, not guesses about why it happened |
| Frequency count | How often does the behaviour happen? | A tally of events in an observation period, with the minutes observed | Compare counts only when observation periods match; convert to a rate |
| Interval recording | Did the behaviour happen in each timed block? | One mark per interval: scored or not scored | Partial-interval scoring tends to overstate and whole-interval scoring tends to understate; choose one and keep it |
| Discrete trial | How did the client respond on each opportunity? | The prompt level and response for every trial | It has its own sheet on the discrete trial data sheet page |
ABC data sheet with a fictional example
ABC data records the antecedent (what happened just before), the behaviour and the consequence (what happened just after) for each event. The three fictional entries below describe observable events in plain words. They record what happened, not why; interpreting a pattern is the supervising clinician’s job.
| Time | Antecedent | Behaviour | Consequence |
|---|---|---|---|
| 10:05 | Staff placed a worksheet on the table and asked Client A to begin | Client A pushed the worksheet off the table | Staff picked it up and offered the break card |
| 10:20 | Staff handed Client A a break card at the end of the task | Client A handed the card back and walked to the mat area | Staff set a two-minute timer for the break |
| 10:41 | Another child entered the room during a task | Client A covered their ears and left the table | Staff offered a quieter seat and the task resumed |
The entries are invented. They do not show a recommended response or a clinical conclusion.
Frequency data sheet and how to turn a count into a rate
A frequency sheet tallies each time the behaviour happens during an observation period and records how many minutes were observed. A count is only comparable with another count from an observation of the same length, so convert counts to a rate: the count divided by the minutes, multiplied by 60 for a rate per hour.
In the fictional example, Sessions 1 and 2 both have a count of 6, but the rates differ because the second observation was longer: 6 ÷ 30 × 60 = 12 per hour, and 6 ÷ 45 × 60 = 8 per hour. Session 3 has a smaller count but the highest rate: 5 ÷ 20 × 60 = 15 per hour.
| Observation | Minutes observed | Count | Rate per hour |
|---|---|---|---|
| Session 1 | 30 | 6 | 12 |
| Session 2 | 45 | 6 | 8 |
| Session 3 | 20 | 5 | 15 |
Counts, minutes and rates are invented arithmetic, not a benchmark or a target.
Interval recording sheet with partial and whole intervals
An interval sheet divides the observation into equal blocks and records, for each block, whether the behaviour was scored. Partial-interval scoring counts a block if the behaviour occurs at any point in it, which tends to overstate how long the behaviour lasted. Whole-interval scoring counts a block only if the behaviour fills it, which tends to understate. Momentary time sampling checks only the moment each block ends. Interval data estimates how much of the observation period the behaviour covered; it does not give an exact count or duration.
The fictional table scores the same ten intervals two ways, as if from one recording. Partial-interval scoring marks 4 of 10 intervals, which is 40%. Whole-interval scoring marks 1 of 10, which is 10%. The gap shows why a team picks one method and keeps it. The scoring worksheet linked below gives more room for longer observations.
| Scoring | 1 | 2 | 3 | 4 | 5 | 6 | 7 | 8 | 9 | 10 |
|---|---|---|---|---|---|---|---|---|---|---|
| Partial interval | No | Yes | No | Yes | No | No | Yes | No | Yes | No |
| Whole interval | No | No | No | Yes | No | No | No | No | No | No |
Yes means the interval was scored. Percent of intervals is scored intervals divided by total intervals.
Agree the definition and the method before recording
Sheets only produce useful data if every observer records the same thing. The checks below happen before the first observation, and the supervising clinician signs off the definition and the method.
- Write the behaviour definition in observable terms and agree it with the supervising clinician.
- Decide which sheet answers the question: ABC, frequency or interval.
- Set the observation period, the interval length and the setting, and keep them the same from one session to the next.
- Train every observer on the same definition and practise with a short example before using the sheet.
- Record at the time of the event rather than from memory afterwards.
- Total the sheet the same way each time and note anything unusual about the session.
Keep paper data with the clinical record
Use a client reference code instead of a full name on printed sheets, store them where only the staff who need them can reach them, and follow the clinic’s own policy for filing, scanning and retention. Totals usually move into the session note under the clinic’s review policy.
TherapyCRM Session Runner records trial outcomes, prompt levels and notes against active targets in a versioned treatment plan, in the web app on a tablet or computer. Session Runner supports frequency with a counter lane and duration with a numeric-series lane; interval scoring needs a separate workflow. The printable sheets on this page offer paper workflows for those methods. The clinician chooses how to measure each goal.
TherapyCRM serves English-language practices in Canada outside Quebec. It is practice management software with a clinical record, not a physician EMR, and has no EMR certification. It has no telehealth or video visits and does not submit insurance or government claims, including Ontario Autism Program claims.
Print, copy and adapt the pack
The pack prints on US Letter paper and the Word version can be edited, so a clinic can add its name, change the number of rows or split the pack into separate sheets. The layouts are original to this page. Replace the example definitions with the clinic’s own, and keep a dated copy of each version of a sheet that staff used.
Frequently asked questions
What is an ABA data sheet template?
It is a blank form for recording observations of a behaviour or skill in a consistent way. This pack has three sheets, ABC data, a frequency count and interval recording, with fictional examples of how each is filled in. A supervising clinician defines the behaviour and chooses the method.
What is ABC data in ABA?
ABC data records the antecedent, which is what happened just before an event, the behaviour itself and the consequence, which is what happened just after. The sheet records observable events in plain words; interpreting a pattern is left to the supervising clinician.
What is the difference between frequency and interval recording?
Frequency recording counts each occurrence during an observation period. Interval recording divides the period into equal blocks and records whether the behaviour was scored in each block. Frequency gives a count that can become a rate, and interval gives an estimate of how much of the period was covered.
What is the difference between partial-interval and whole-interval recording?
Partial-interval scoring counts a block if the behaviour occurs at any point in it, which tends to overstate how long the behaviour lasted. Whole-interval scoring counts a block only if the behaviour fills it, which tends to understate. The team chooses one method and keeps it.
How do I calculate a rate from a frequency count?
Divide the count by the minutes observed, then multiply by 60 for a rate per hour. In the fictional example, 6 events in 30 minutes is 6 ÷ 30 × 60 = 12 per hour.
Who decides which data sheet to use?
The supervising clinician. The choice depends on the question, the behaviour definition and the setting, and the clinic’s own documentation policy decides how the sheets are stored and reviewed.
Can TherapyCRM record frequency, duration or interval data?
Session Runner records trial outcomes, prompt levels and notes against active targets. Session Runner supports frequency with a counter lane and duration with a numeric-series lane; interval scoring needs a separate workflow, such as the printable sheets in this pack.
Where is the discrete trial data sheet?
It has its own page, with a ten-trial fictional example and a printable PDF or Word download. This pack covers the other common sheets: ABC, frequency and interval.