For Canadian practices outside Quebec
Behaviour scatterplot data sheet: time windows, context and coverage
An ABA behaviour scatterplot data sheet maps a defined event across time windows and days. It can help a team choose where to observe more closely. A marked square describes an observation window; it does not establish why the event occurred or how many times it occurred unless the recording key explicitly counts events.
Fictional example only. Adapt this to your clinic’s own policy and professional judgment. It is not clinical, legal or regulatory advice and does not claim to meet any payer, regulator or certification-body requirement.
Last checked: 2026-10-10
Download a printable behaviour scatterplot sheet (PDF or Word)
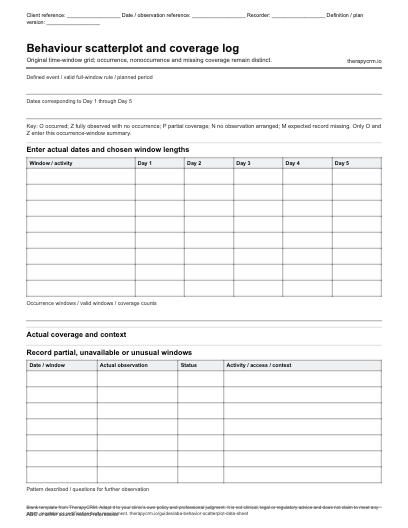
Original time-window grid; occurrence, nonoccurrence and missing coverage remain distinct. The blank PDF prints on US Letter paper (2 pages) and the Word document can be edited to match your clinic’s fields. Both are free to download with no sign-up.
A behaviour scatterplot is a time-window grid
In behaviour recording, a scatterplot commonly places time windows down one axis and dates across the other. IRIS describes its use for observing time and context patterns [MEA1]. This differs from a statistical scatter chart plotting the relationship between two numeric variables.
Use the same definition and window lengths across comparable cells. An occurrence-only key answers whether an event happened at least once; it does not provide exact frequency, duration or behavioural function. Select the observation arrangement for a meaningful clinical question rather than assume every hour requires monitoring.
Fill the original blank scatterplot sheet
The pack includes a weekly grid and a coverage/context log. Keep the key written on the sheet so a blank cell cannot be mistaken for “did not occur”.
- Define the observable event, reference period, recorder and definition version.
- Enter the dates and planned time windows. State whether the whole window must be observed for a valid occurrence/nonoccurrence cell.
- Use an explicit key: O = occurred in a valid window; Z = fully observed with no occurrence; P = partial coverage; N = no observation arranged; M = expected record missing.
- Record the cell promptly and add the actual activity, coverage and unusual context to the second page.
- Summarize O and Z cells using only valid comparable windows, with P, N and M counts visible.
- Review where further observation is useful. Use an ABC or timing record for detail rather than assigning a cause to a dark cell.
Completed fictional scatterplot with a clear key
Fictional definition S1 records whether Client F says “help” or uses their agreed help symbol at least once during each chosen ten-minute activity window. Monday to Wednesday are invented observation days. No additional communication prompt is given in the recorded O cells; the definition is illustrative, not a goal.
Swipe or scroll sideways to view all table columns.
| Window / activity | Monday | Tuesday | Wednesday | Valid summary |
|---|---|---|---|---|
| 09:00–09:10 / drawing setup | O | O | P — 4 minutes only | 2 occurrence / 2 valid windows |
| 09:20–09:30 / chosen puzzle | Z | O | N — not scheduled | 1 occurrence / 2 valid windows |
| 09:40–09:50 / putting materials away | M — record absent | Z | Z | 0 occurrence / 2 valid windows |
| Coverage | 2 valid; 1 missing | 3 valid | 1 valid; 1 partial; 1 not scheduled | 6 valid of 9 grid cells |
O and Z are fully observed windows under this example’s rule. P, N and M are not valid occurrence/nonoccurrence scores.
Interpret the grid without replacing missing cells with zero
Across six valid windows, the event occurred in three: 3 ÷ 6 × 100 = 50% of valid windows. Report one partial window, one unscheduled window and one missing record alongside that percentage. Dividing by nine would silently count unknown or unavailable observations as nonoccurrences.
The drawing row has two valid occurrence windows, but only two fully observed days. Write “2 of 2 valid windows; one partial window” rather than “every day”. A single O cell could contain one request or several, so this grid cannot support a requests-per-hour calculation.
The next review question could be whether access to materials and opportunities differ across activities. That is a question for further observation, not proof that the activity caused the event. Record opportunities and environment alongside counts if the clinician needs those comparisons.
Use context records and avoid common scatterplot mistakes
If an occurrence needs more detail, record observable events before, during and after it in the ABC sheet, with the same definition reference. A time pattern can help schedule descriptive observations, but neither a scatterplot nor an ABC sequence establishes a functional relation by itself.
Common mistakes are using unequal windows without disclosure, changing the key partway through a week, treating unscheduled hours as zero, and calling an occurrence grid a frequency count. Do not add a clinical intensity label without a defined and reviewed scale. Preserve the original grid and document corrections rather than overwriting uncertainty.
Use the sheet, tools and clinical record together
Use fictional or deidentified information in the public tools. Keep identifiable observations and completed forms in the practice-approved clinical record under the clinic’s access, retention and amendment policies.
A public worksheet helps prepare and inspect a recording format. It does not authorize a treatment, decide mastery, replace consent or turn a draft into a reviewed clinical record. A clinician should confirm definitions, denominators and interpretation before the team uses the form.
TherapyCRM serves English-language practices in Canada outside Quebec. It is practice management software with a clinical record, not a physician EMR, and has no EMR certification. It has no telehealth or video visits and does not submit insurance or government claims, including Ontario Autism Program claims.
Sources and scope of this original resource
The blank record and every worked entry are original TherapyCRM examples. Sources explain the professional topic; they do not endorse this template. School resources and research studies require interpretation by a qualified clinician for a real clinic. No standardized assessment, publisher form or licensed guideline is reproduced.
Source references
- [MEA1] IRIS: Measuring Behavior. Educational discussion of operational definitions, observation methods, scatterplot recording and graphing. Checked 10 October 2026; school examples do not establish Canadian clinic requirements.
- [BSP1] IRIS: Implementation and Progress Monitoring. School-context explanation of implementation fidelity and progress monitoring. Checked 10 October 2026. It does not set clinic observation schedules or treatment requirements.
Frequently asked questions
What is an ABA scatterplot data sheet?
It is a grid of dates and time windows with a shared key showing occurrence, nonoccurrence and observation coverage for a defined event.
Is it the same as a statistical scatter chart?
No. A behaviour time-window scatterplot organizes observations across a day or week. A statistical scatter chart plots two numeric variables.
Does a marked square show the exact event count?
Only if the recording key explicitly collects counts. In this occurrence-only example, O means at least one occurrence in a valid window.
Can unobserved windows be recorded as zero?
No. Use separate states for partial coverage, no arranged observation and a missing record. Zero requires a valid observed window with no occurrence.
Can a scatterplot tell me a behaviour’s function?
No. It can highlight patterns and guide further descriptive observation. A qualified clinician must evaluate assessment evidence and competing explanations.
How do I summarize a week?
Report the number of occurrence windows over valid comparable windows, plus coverage and exclusions. Keep different definitions or window lengths separate.